Supply chain planning is a complex process that impacts nearly all aspects of a business, from profitability to resilience. Decisions made during the supply chain planning process translate to real-world business outcomes, influencing how much inventory you stock, how satisfied your customers are, and your bottom line.
Despite its importance, effectively managing and working with your business’ inventory data, anticipating demand, analyzing inventory, and making the right buying decisions can be challenging. This is often due to the sheer amount of data you need to work with, and the complexities of demand forecasting.
To do all of those things accurately and efficiently, you need to know how to cut through the noise, handle mountains of data, and be able to distill insights from advanced algorithms with ease. For that, you can turn to today’s intelligent demand planning software.
This in-depth post will cover everything you need to know about the nuances of using demand planning software, including what you need to know about the basics of statistical forecasting, and how you can use demand planning software to determine if you should stock a SKU.
What is Demand Planning Software?
Demand planning software allows you to use your business’ inventory data to anticipate future needs, using different forecasting approaches and algorithms. Depending on what type of data is available, you can choose to use different forecasting approaches within your demand planning software and can select one that will best meet your needs.
Demand planning software is powerful because it doesn’t just take sales history into account: it also uses advanced forecasting approaches that incorporate things like seasonality, volatility, and bias into projections. This software is so powerful, it can also help you determine (very clearly) if you should stock a SKU, and what kind of order policy should govern a group of items.
However not all demand planning software is created equal, and different software has different features and strengths. Many businesses use some type of inventory management solution, but as it turns out, many leaders are not happy with the solutions they’ve implemented. One survey found that more than 50% of businesses say they’ve implemented demand planning and forecasting solutions, but their system needs improvement.
Let’s explore how demand planning software can help you with the forecasting process, based on the capabilities and systems within StockIQ.
The Basics of Forecasting
Demand planning software is powered by statistical forecasting models, which use different algorithms to predict what inventory demand will be like in the future. While all demand planning software is different, we will dissect how StockIQ functions.
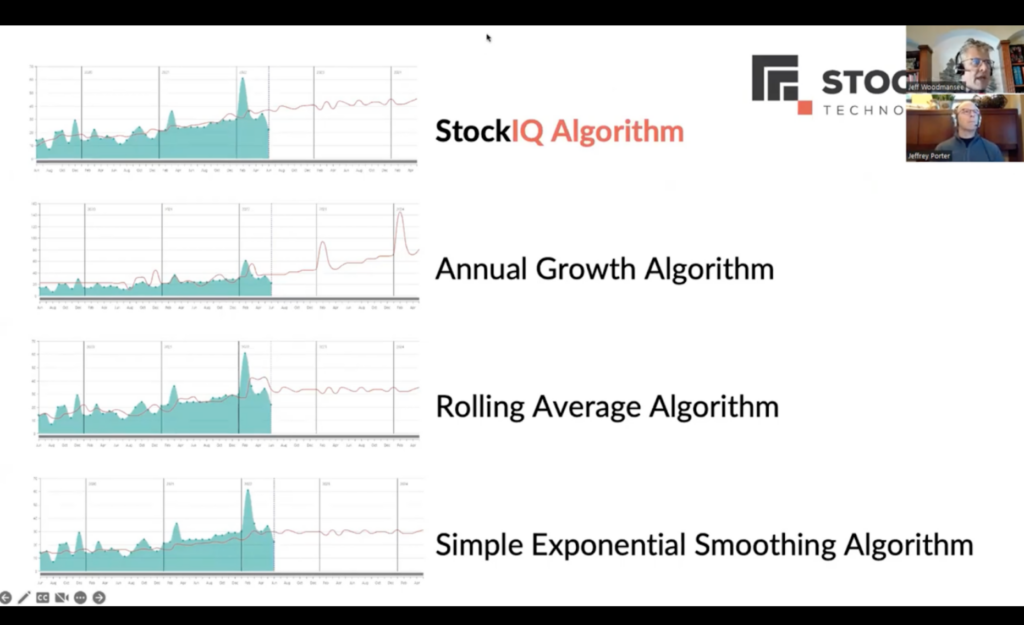
Demand planning software generates a graph with peaks and valleys, and when you use StockIQ, it generates a trend line. StockIQ is capable of doing this across four different algorithms or methods: three common ones, and one that is specific to StockIQ. For the same time series, these different algorithms will result in a different output.
The first three methods are the Annual Growth Algorithm, Rolling Average Algorithm, and Simple Exponential Smoothing Algorithm. The StockIQ forecasting algorithm is a combination of several different forecasting approaches and can forecast across the broadest array of items.
StockIQ Algorithm
A bit of background: the StockIQ forecasting algorithm started as a linear regression algorithm. After that, trend, seasonality, volatility control, and bias detection were all added in, to continue to enhance it and maximize its capabilities.
Here are the various variables that are part of the StockIQ algorithm, and what they do and reflect.
Volatility
Volatility is characterized as the algorithm creating a nice “smooth” forecast, instead of chasing data points that are more choppy. Volatility determines the length of time that StockIQ uses when creating its trend line (whether it’s 6 months, 6 months blended with 12 months, or greater than 12 months), to determine how volatile the algorithm is, and if it’s chasing data points.
Some things to note about this:
- If it’s left to its own devices, the StockIQ algorithm seeks to take the most stable approach and picks the lowest volatility, but users have the opportunity to adjust that.
- When less data is available, StockIQ adjusts to a shorter horizon automatically, so that the volatility is sensible for new parts.
- High volatility settings result in more reactive forecasts, where historical forecast error usually goes down. Keep in mind that higher reactivity is tough to buy.
Very Low Volatility
There’s a low volatility setting for items that you’ve had for a substantial amount of time. This looks at no less than 12 months of history for its smoothed averages. This is often best if you want a smooth forecast that’s well-suited for purchasing.
Bias Detection
The StockIQ algorithm also has built-in bias detection, which keeps the statistical model from continuously over-forecasting or under-forecasting by more than 5%. The model essentially checks itself, and if in the last 12, 6, or 3 months it’s 5% above or below the forecast 75% of the time, then volatility is automatically corrected. Essentially, the StockIQ algorithm is self-correcting for bias.
Bias detection can be useful, especially when it comes to sales forecasts because bias tends to be present in these forecasts. For example, salespeople can often be fairly optimistic, and as they’re setting targets, might be under-forecasting. However, the opposite can be true in operations, where we might be over-forecasting to make sure we have enough product. When we start experiencing the actual sales, we’re looking for a shift in the demand: is it consistently going lower, or consistently going higher? When we answer that, we can make changes within the algorithm.
Damping
Damping is another variable you can set within the StockIQ algorithm. It determines how quickly the trend “tails off” as you move out in time. The assumption is that no trend continues forever. For example, if your trend is ascending like an airplane, the assumption is you eventually reach your peak “altitude,” and level off, instead of continuing to climb forever. Essentially, damping controls how quickly you’ll level off or flatten out.
Fast Start Enabled
This feature is useful for forecasting new items. Let’s say you set a model to forecast for an item on “day created,” but don’t start selling it for a couple of months. Fast start enabled ignores the series of “zero” data points that occur before you begin selling new items, skip trending, and ramps forecast quickly.
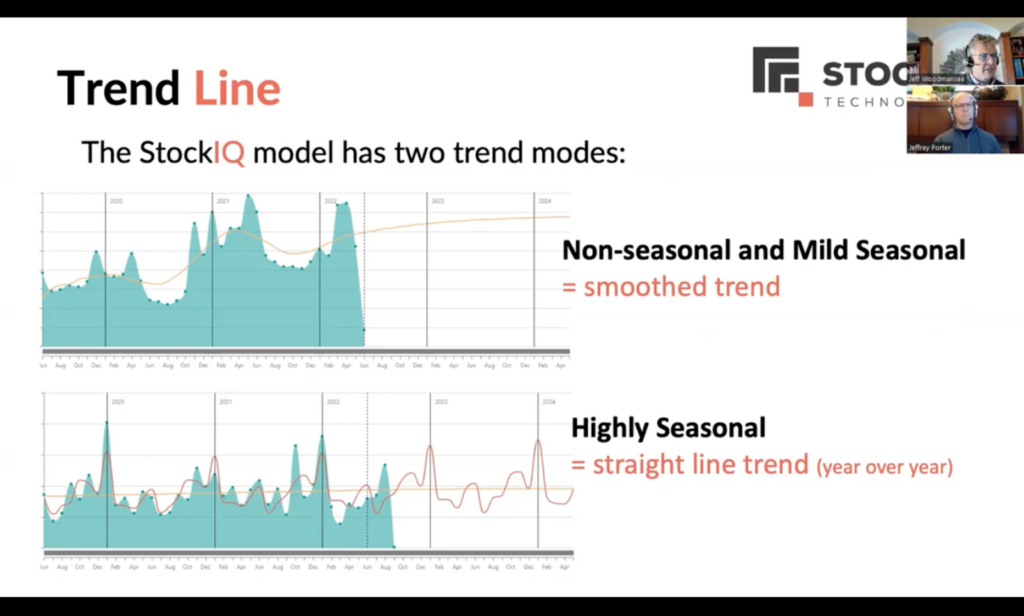
Note that the StockIQ model has two trend modes:
- Non-seasonal and Mild Seasonal: For items that fall into these categories, you’ll see a very smooth trend.
- Highly Seasonal: When an item is highly seasonal, you’ll see a straight line (more of a year-over-year trend).
Seasonality Calculation
For seasonality, the StockIQ algorithm can automatically calculate the seasonal curve for you if there are at least 18 months of demand history. 24 months of history is preferred, so that the system can evaluate two of each month. The StockIQ algorithm then analyzes the data, to see how correlated the peaks and valleys are.
If there’s a correlation of at least 15%, it’s considered to be mild seasonality. If there’s a correlation of more than 40%, it’s considered to have high seasonality.
If an item is new (so it has no history) or it has less than 18 months of history, it’s still possible to find seasonality from elsewhere. For example, you can inherit seasonality from the product group or another node in the hierarchy instead of having none. You can also build your seasonal profile in the system configuration.
What are the Goals of Forecasting?
When using demand planning software, it’s important to identify what your forecasting goals are. With that in mind, we’d like to bring up a common forecasting maxim: every forecast is wrong.
While that might seem counterintuitive, this understanding can be very helpful for proper demand planning.
There’s a quote which says the following, by professor & forecaster Paul Saffo:
“The goal of forecasting is not to predict the future, but to tell you what you need to know to make meaningful action in the present.”
This quote represents the idea that while forecasts are often not accurate, they can still give you useful insights into what your buying and stocking habits should look like.
This perspective can be useful for many types of inventory-based businesses, but it can be particularly useful for ones that bring in products from overseas, where lead times are often very long. With forecasting, you can take meaningful action on longer lead-time products. This data can also be critical for demand planners and replenishment planners who are often working with these forecasts, and might be in positions where they’re facing questions as to why they’re “wrong.”
When this happens, it’s important to lean on forecasts, review them, and consistently evaluate them, so you can still be confident that the information you’re presenting is the best that’s likely going to exist. This information is still critical for building business plans, so don’t be afraid to take ownership of it, and be confident with what you’re delivering to the rest of the team.
With that in mind, one goal of forecasting can be to move towards using one single forecast. This means that instead of having an independent forecast for business units such as sales, operations, and finance, your organization moves forward with one number.
One of the areas where StockIQ shines as demand planning software is statistical forecasting, which can be the foundation of your forecasting or even your primary forecasting method.
Determining if You Should Stock a SKU
As you manage the inventory for your business, another excellent use of demand planning software is to determine if you should stock an SKU or not. When evaluating if you should stock something or not, you can walk through the following rationalization questions:
- Is this a critical item that must be available for immediate delivery?
- Can a customer find this product on the shelf at one of our competitors?
- Is the profit margin on this product so high that it offsets the cost of carrying the item in stock for an extended period?
- Can we sell another product in place of this product?
- Can we centrally locate the inventory of this product in a central warehouse or DC and have other branches draw from it?
If we think about this process, and consider how demand planning software such as StockIQ can help with it, several use cases come to mind. There are also several strategies you may use to help enhance your understanding of the inventory you need to have on hand and how to best manage your overall inventory needs.
ABC / XYZ
This matrix is based on the Pareto principle, which states that in many cases, 80% of outcomes come from 20% of causes, and determines that there are a few SKUs that are the most impactful to your business.
Within StockIQ, this can be a dynamic calculation: you can tell StockIQ to recalculate it over time, at a certain interval, to make sure it’s appropriate for helping you still which insights are relevant. For example, something that’s an “A” today might be a “B” in the next couple of months, or vice versa.
Order Policy Matrix
It’s important to match order policies to ABC/XYZ categories, to drive appropriate behavior. Normally, when you do an ABC/XYZ process, items will fall where you expect them to. But sometimes, they can fall into a different category. When this is the case, you can use order police overrides to help remedy the situation.
Diving into ABC/XYZ Stratification
The ABC stratification method looks at items (using the Pareto principle) and identifies their importance to the business. It functions as follows:
- A- Very important.
- B- Important.
- C- Not nearly as important.
- D- Not that important, but might be purchased by key customers, so you keep them on the shelves.
- N- New product.
- X- Dead (no sales in 12 months).
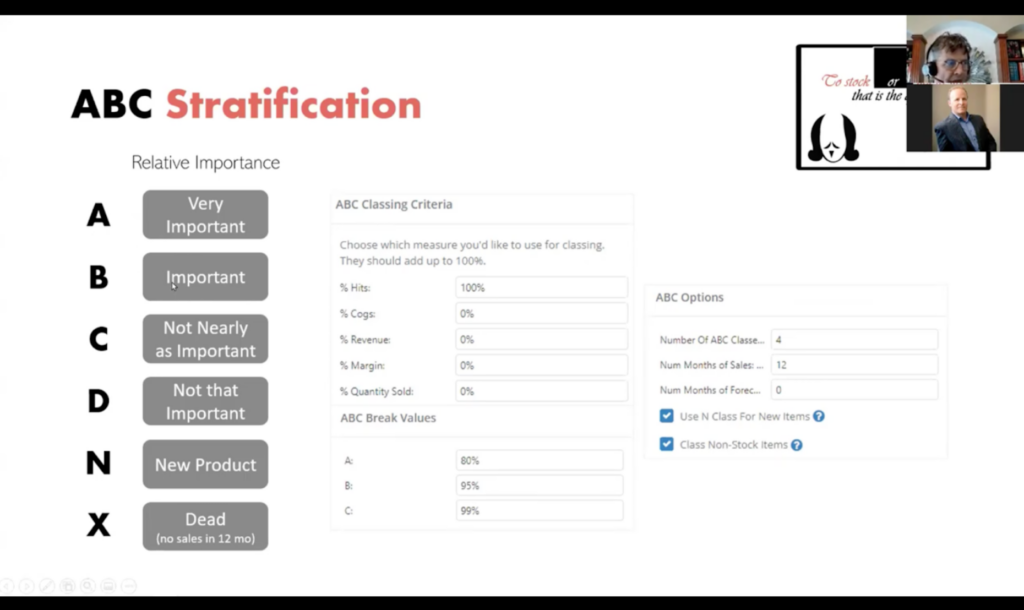
When you’re using demand planning software like StockIQ, you can also take advantage of different settings, such as Hits, Costs, Revenue, Margin, and Quantity Sold, and determine how much to blend each of those attributes. Lastly, you can determine how many categories are in the ABCs, how many months of historical sales you want to look at, or if you want a forward-looking component (which can be useful for newer items, that have less history).
There’s another component to this system: the XZY stratification, which is often not as well-known as the ABC stratification. It’s another axis on which you can grade items. You can conduct XZY stratification across different attributes, including Usage Pattern, Forecast Model Error, and Coefficient of Variation.
If you’re doing XYZ stratification for Usage Pattern, it would reflect:
- X- Recurring (items you sell regularly)
- Y- Sporadic (items you sell less frequently)
- Z- Slow (items you sell even less frequently)
- N- New products
Forecast Model Error and Coefficient of Variation have to do with how well we predict the usage or sales of an item.
For example, when referencing Forecast Model Error:
- X- Low forecast error (we’re good at forecasting these items)
- Y- Medium forecasting error (we’re fair at forecasting these items)
- Z- High forecasting error (forecasting these items is challenging).
- N- New products
Coefficient of Variation is a different mathematical calculation, and it essentially tries to say:
- X- Predictable (and likely has low forecasting error)
- Y- Somewhat predictable (and likely has medium forecasting error)
- Z- Not predictable (and likely has high forecasting error).
- N- New products
Whichever one of these you choose to use, you can see that they line up fairly similarly. For example, items with recurring demand are easy to forecast, because there are lots of data points on them, and they tend to be very predictable. Items that you order more sporadically have medium errors, and they’re somewhat predictable. Lastly, the items you order least tend to have high errors and are not predictable.
No matter which one of these you decide to use, they’re all rooted in the same thought process. And ultimately, when you use StockIQ, you end up with a robust ACB/XYZ Stratification. The AX’s are the most important, recurring items and the level of importance and predictability goes down as you move further down in the matrix. The AX’s are your “bread and butter items,” and you want as many items in this category as possible.
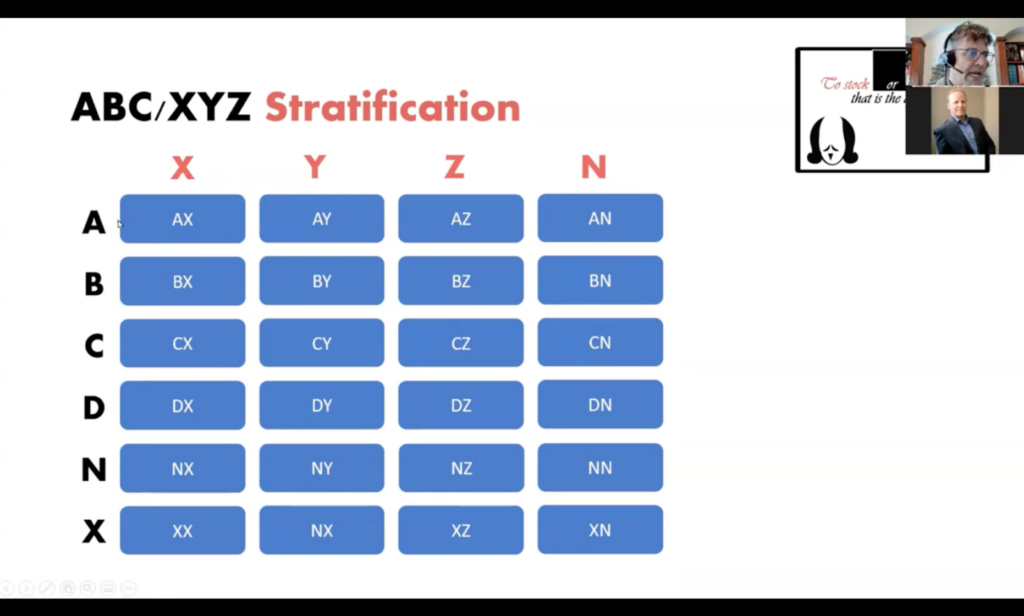
When determining whether to stock or not a SKU, you can look to this ABC/XYZ Stratification matrix. While the following graph is not specifically in StockIQ, you can use it as a guideline to determine what you should stock.
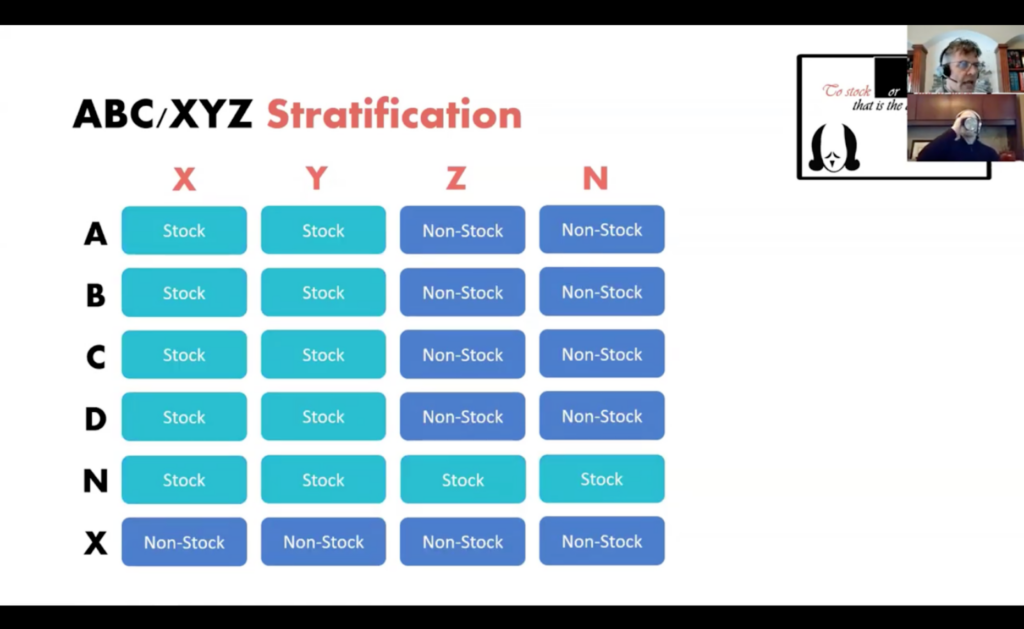
Once you make a decision whether to stock an item or not (based on the given category), then you can take things one step further, and determine which order policy you want to govern the group of items.
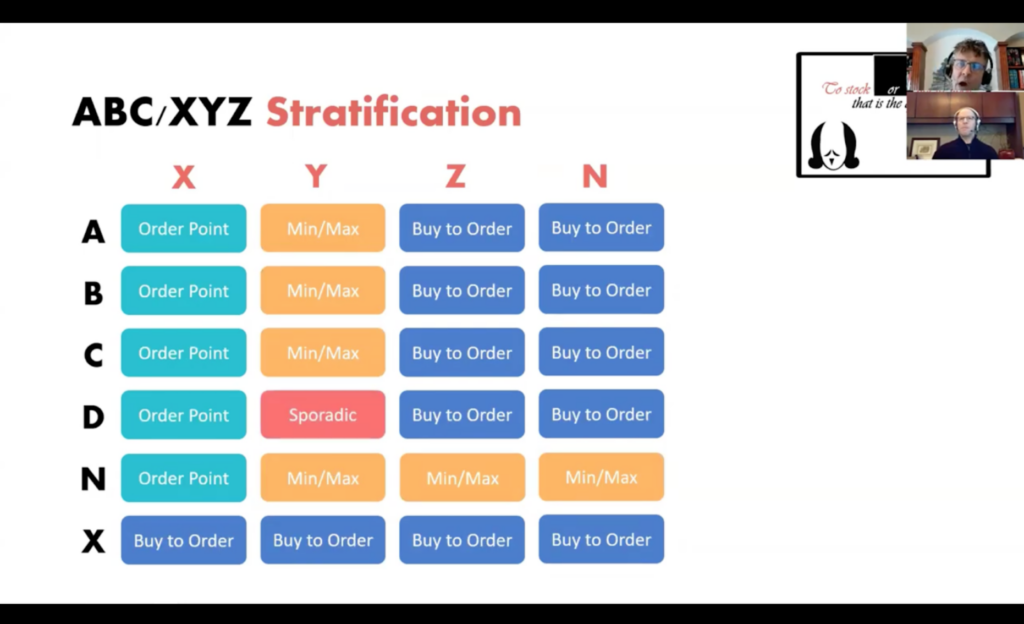
For example, with AX items (your most important items), you’ll likely want to use your most sophisticated order policy.
Understanding Forecast Hierarchies
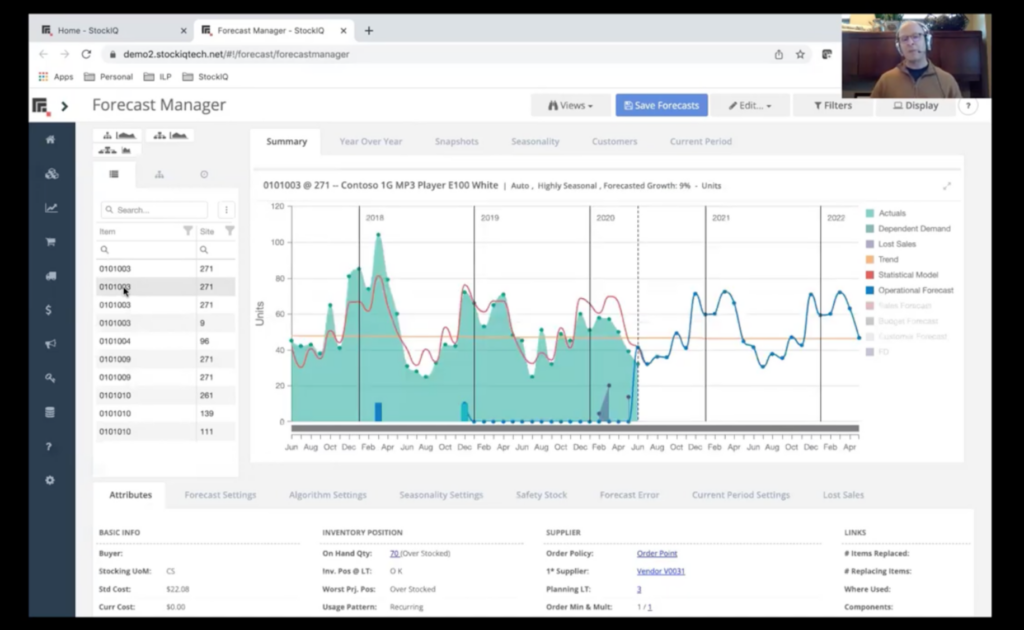
StockIQ is a hierarchical-based planning solution, which means you can do a bottom-up forecast or a top-down forecast. You also can organize your items and SKUs by product categories, and begin making mass changes on individual levels.
However, if you want to manage a forecast at a lower level, you can manipulate individual fields and make mass changes to the overall forecast using the forecast wizard.
Ultimately, you’ll end up with a new operational consensus forecast that you can begin to plan.
StockIQ: Unleashing the Power of Demand Planning Software
Supply chain planning requires the powerful, accurate use of large amounts of data, and today’s advanced demand planning software can help you make accurate, strategic ordering decisions. By understanding how to use this software, and taking advantage of powerful algorithms and forecasting models, you can work with the most accurate inventory projections possible.
If you’re ready to take full advantage of the power of demand planning software, StockIQ is here for you. StockIQ is an advanced supply chain planning suite that allows you to embrace efficiency and achieve effortless supply chain planning.
Find out more about StockIQs powerful demand forecasting tools by contacting us, or request a demo today.
